Definition von Funktionen
Wenn man komplexere Abbildungen mit Schulplots zeichnen will, stellt man häufig
fest, dass eine oder mehrere Funktionen an unterschiedlichen Stellen immer
wieder benötigt werden.
Für diese Fälle kann man in schulplots Funktionen definieren und später an
unterschiedlichen Stellen wieder verwenden.
Funktionen werden im Abschnitt functions definiert, der sich im Abschnitt
axes befindet. Grundsätzlich können beliebig viele Funktionen definiert
werden.
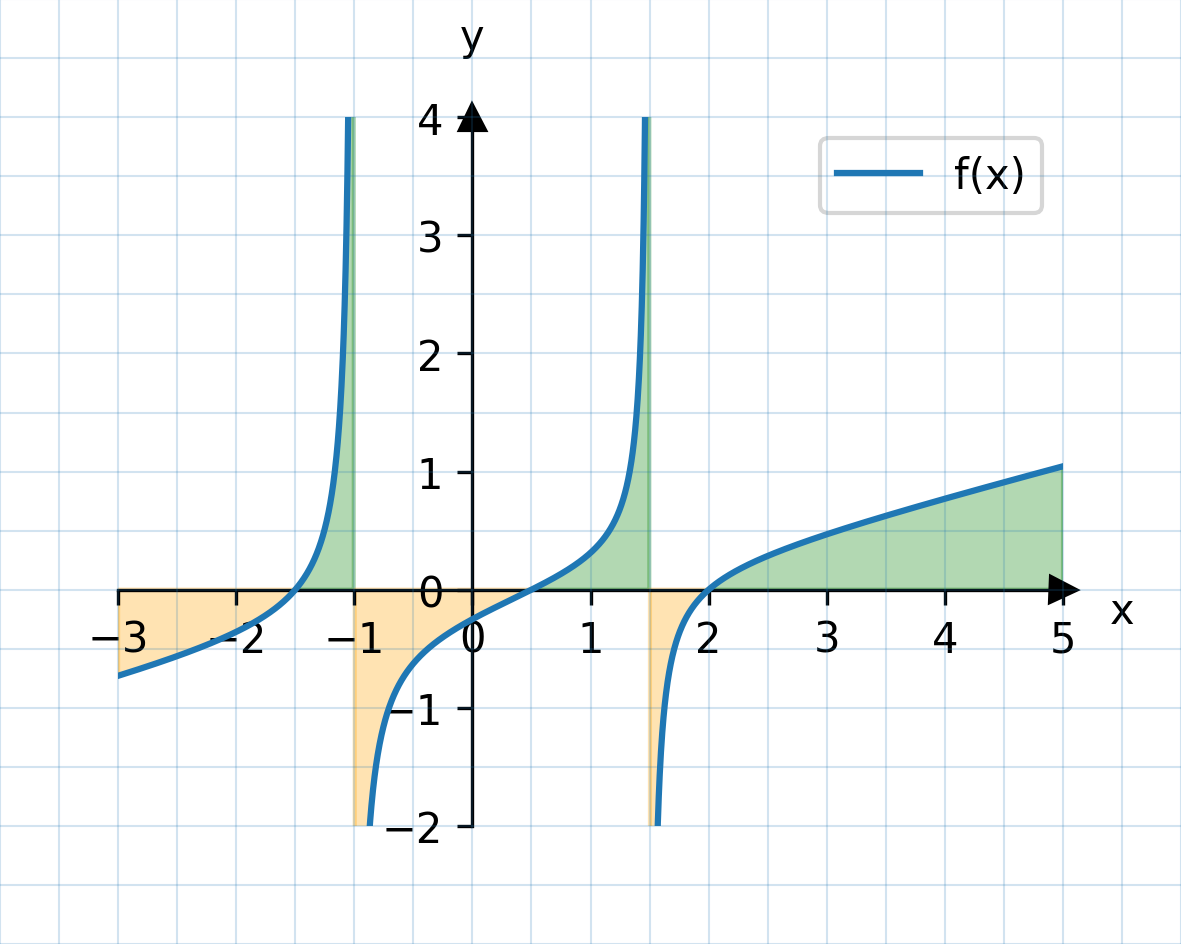
Beispiel 1: Graph und Fläche unter dem Graphen

| figure:
height: 8cm
width: 10cm
axes_descriptors:
- axes:
height: 6cm
width: 8cm
x_min: -3
y_min: -2
bottom: 1cm
left: 1cm
functions:
f: (x-2)*(x-0.5)*(x+1.5) / (4*(x-1.5)*(x+1))
items:
- type: Graph
function: f(x)
label: f(x)
- type: Area
function:
- f(x)
- 0
condition: y1 > 0
plot_args:
alpha: 0.3
color: green
- type: Area
function:
- f(x)
- 0
condition: y1 < 0
plot_args:
alpha: 0.3
color: orange
|
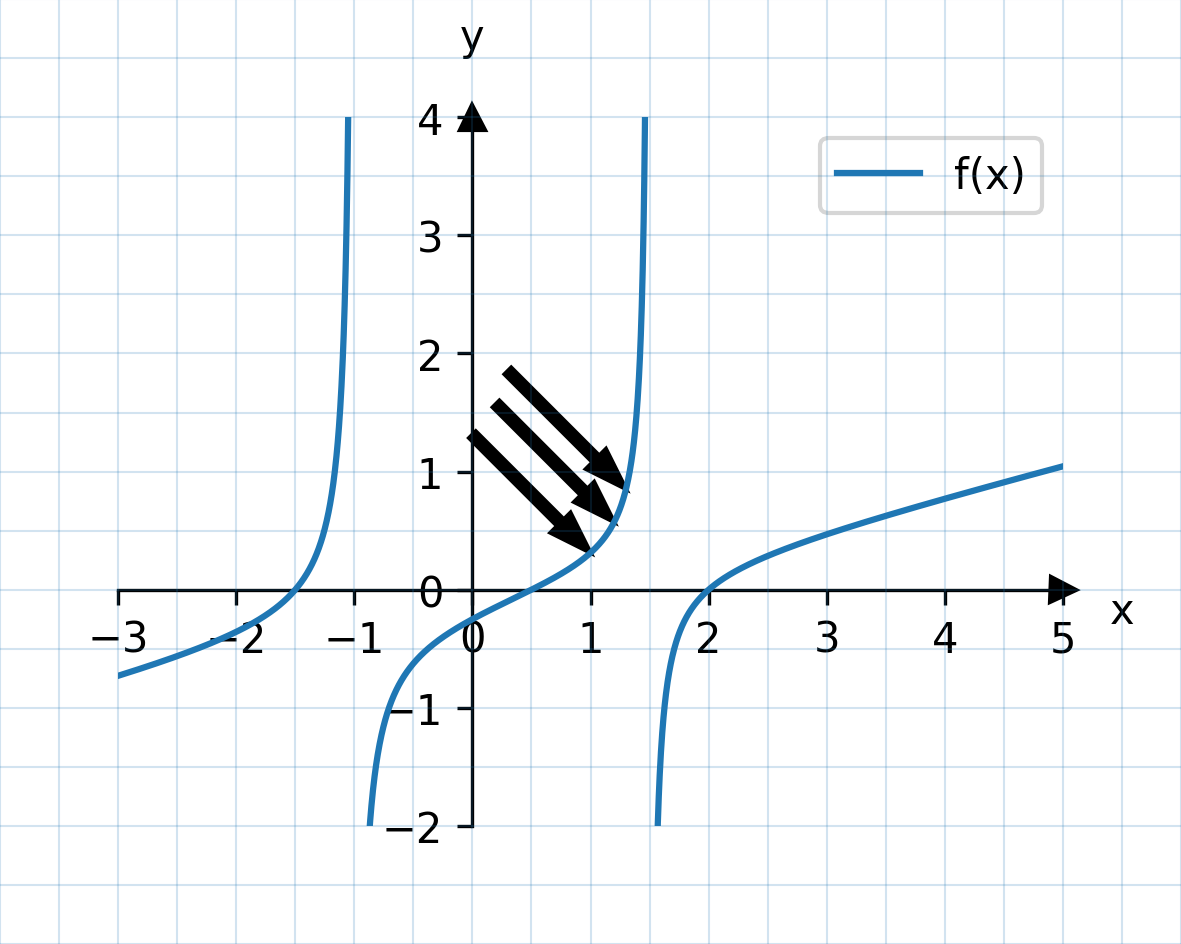
Beispiel 2: Pfeil zeigt auf Graph
Hier zeigen wir, wie man einen Pfeil auf einen Punkt auf dem Funktionsgraphen zeigen lassen kann:

| figure:
height: 8cm
width: 10cm
axes_descriptors:
- axes:
height: 6cm
width: 8cm
x_min: -3
y_min: -2
bottom: 1cm
left: 1cm
functions:
f: (x-2)*(x-0.5)*(x+1.5) / (4*(x-1.5)*(x+1))
items:
- type: Graph
function: f(x)
label: f(x)
- type: Arrow
x: 1
y: f(1)
dx: -1
dy: 1
plot_args:
color: black
- type: Arrow
x: 1.2
y: f(1.2)
dx: -1
dy: 1
plot_args:
color: black
- type: Arrow
x: 1.3
y: f(1.3)
dx: -1
dy: 1
plot_args:
color: black
|

