Punkte
Attribute der point Struktur
| Attribut | Beschreibung | Default |
|---|---|---|
x |
x-Koordinate des Punkts | |
y |
y-Koordinate des Punkts | |
label |
Text-Label des Punktes | |
angle |
Winkel (in Grad) zwischen Punkt und Label; 0 entspricht rechts, 90 entspricht oben etc. | 90 |
distance |
Abstand zwischen Punkt und Label. Wird mit Einheit angegeben. | 0.5cm |
marker |
Marker-Symbol. Siehe matplotlib Dokumentation | x |
plot_args_point |
Einstellungen zur Darstellung des Punktes | |
plot_args_label |
Einstellungen zur Darstellung des Labels |
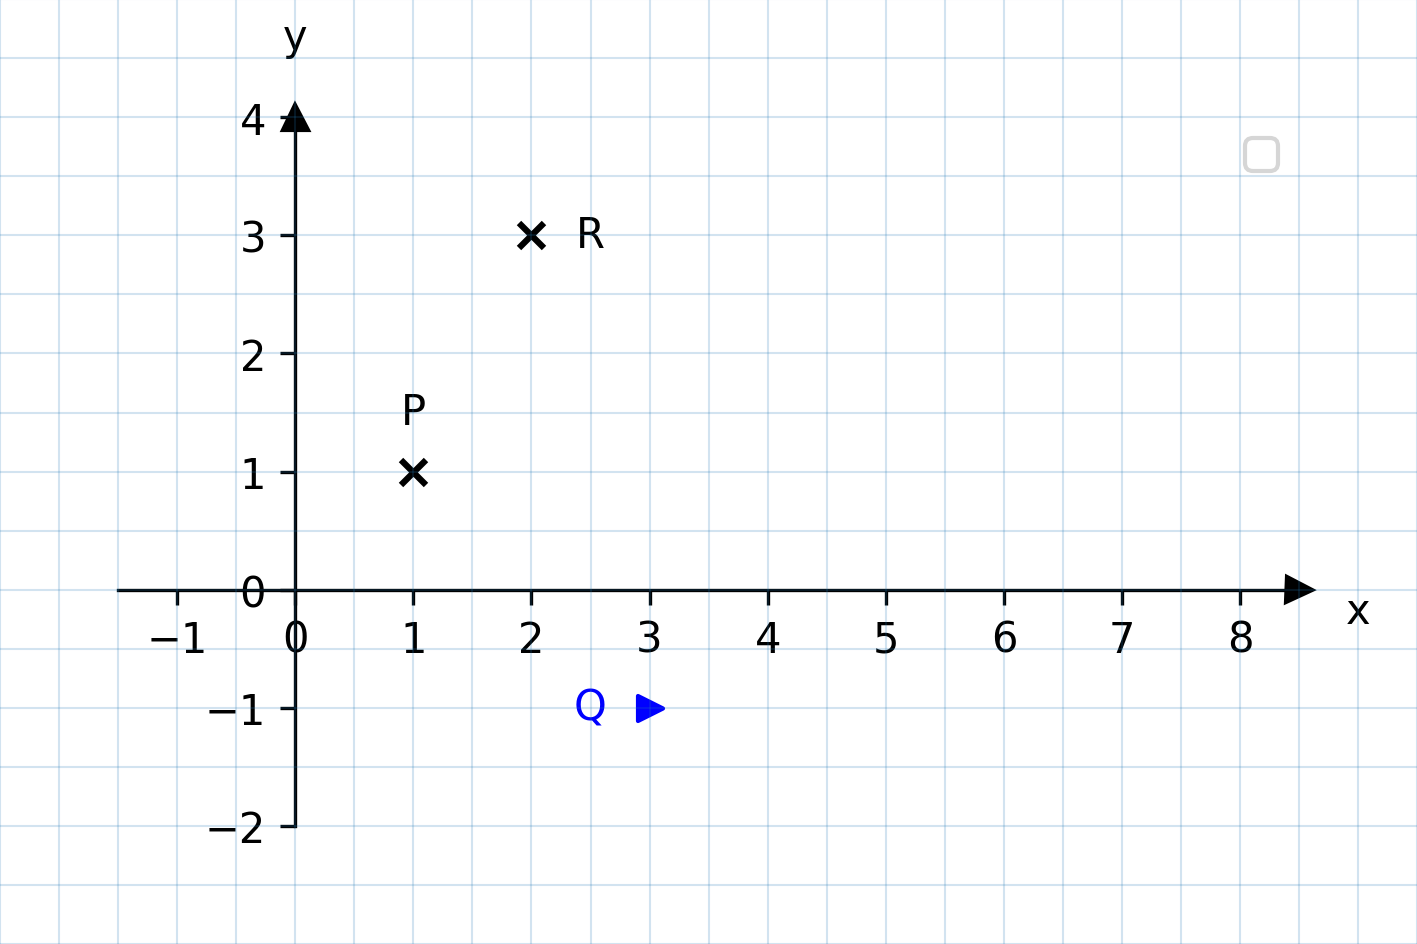
Beispiel 1: Punkte in verschiedenen Stilen

figure:
  height: 8cm
  width: 12cm
axes_descriptors:
- axes:
    height: 6cm
    width: 10cm
    x_min: -1.5
    y_min: -2
    show_legend: true
  bottom: 1cm
  left: 1cm
  items:
  - type: Point
    x: 1
    y: 1
    label: P
  - type: Point
    x: 2
    y: 3
    label: R
    angle: 0
  - type: Point
    x: 3
    y: -1
    angle: 180
    marker: ">"
    label: Q
    plot_args_label:
      color: blue
    plot_args_point:
      color: blue
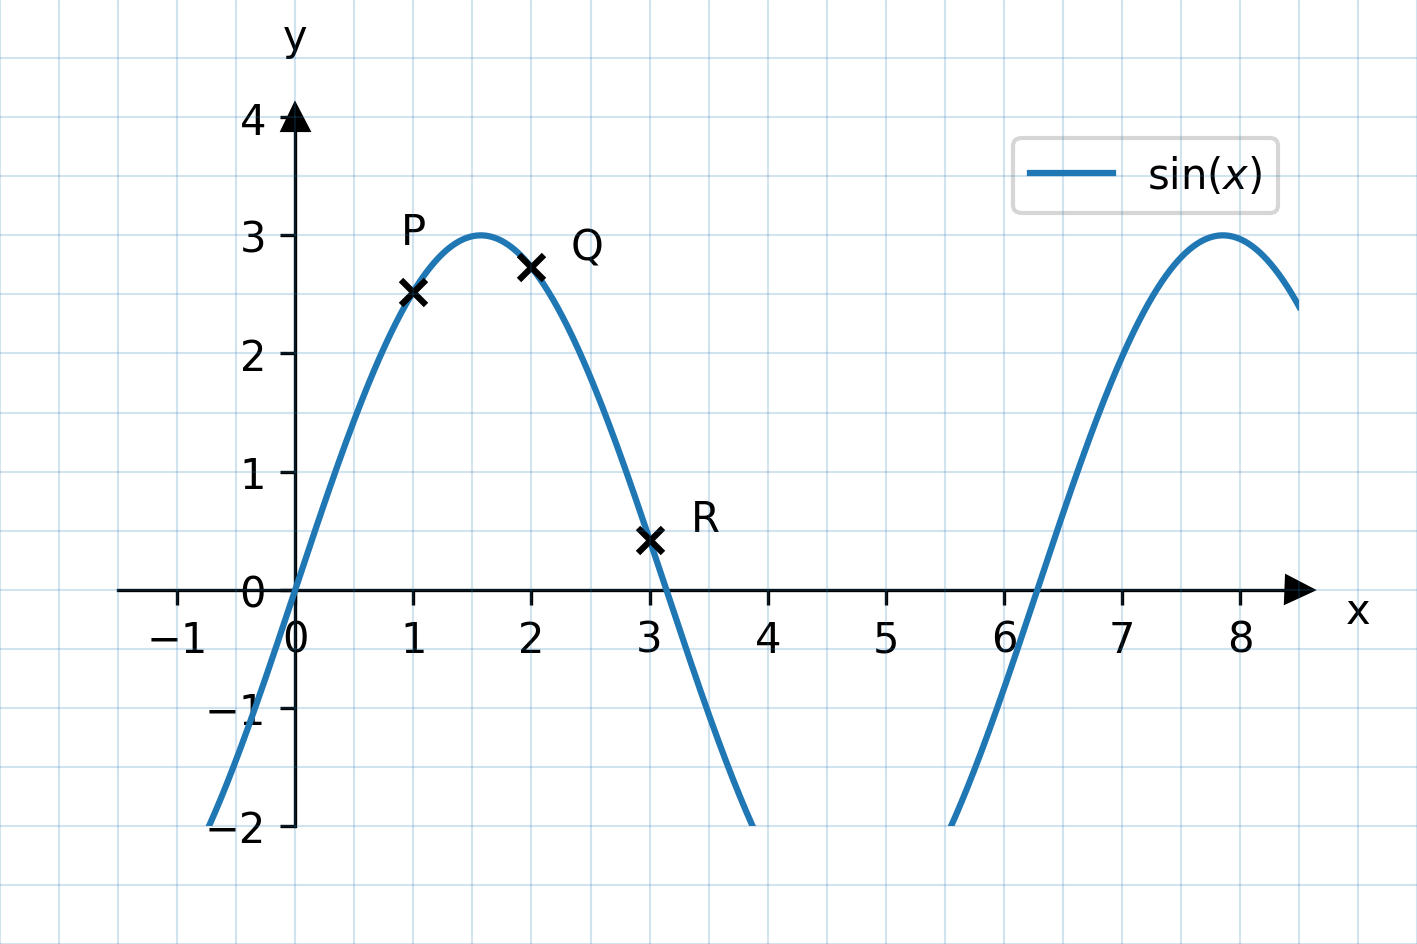
Beispiel 2: Punkte auf einem Graphen
Die Koordinaten können auch mathematische Ausdrücke sein. Insbesondere können auch definierte Funktionen verwendet werden, um Punkte zu zeichnen, die auf einem Graphen liegen:

figure:
  height: 8cm
  width: 12cm
axes_descriptors:
- axes:
    height: 6cm
    width: 10cm
    x_min: -1.5
    y_min: -2
    show_legend: true
  bottom: 1cm
  left: 1cm
  functions:
    f: 3* sin(x)
  items:
  - type: Graph
    function: f(x)
    label: $\sin(x)$
  - type: Point
    x: 1
    y: f(1)
    label: P
  - type: Point
    x: 2
    y: f(2)
    label: Q
    angle: 20
  - type: Point
    x: 3
    y: f(3)
    label: R
    angle: 20