Text
Attribute der Text Struktur
| Attribut | Beschreibung | Default |
|---|---|---|
x |
x-Koordinate des Punkts | |
y |
y-Koordinate des Punkts | |
text |
anzuzeigender Text | |
rotation |
Rotations-Winkel des Texts | 0 |
text_args |
Einstellungen zur Darstellung des Texts |
Die angegebenen Koordinaten beziehen sich standardmäßig auf die linke untere Ecke des Textfeldes. Beispiel 3 zeigt, wie das geändert werden kann.
Für die text_args siehe die Dokumentation von Matplotlib.
Beispiel 1: Texte in verschiedenen Stilen
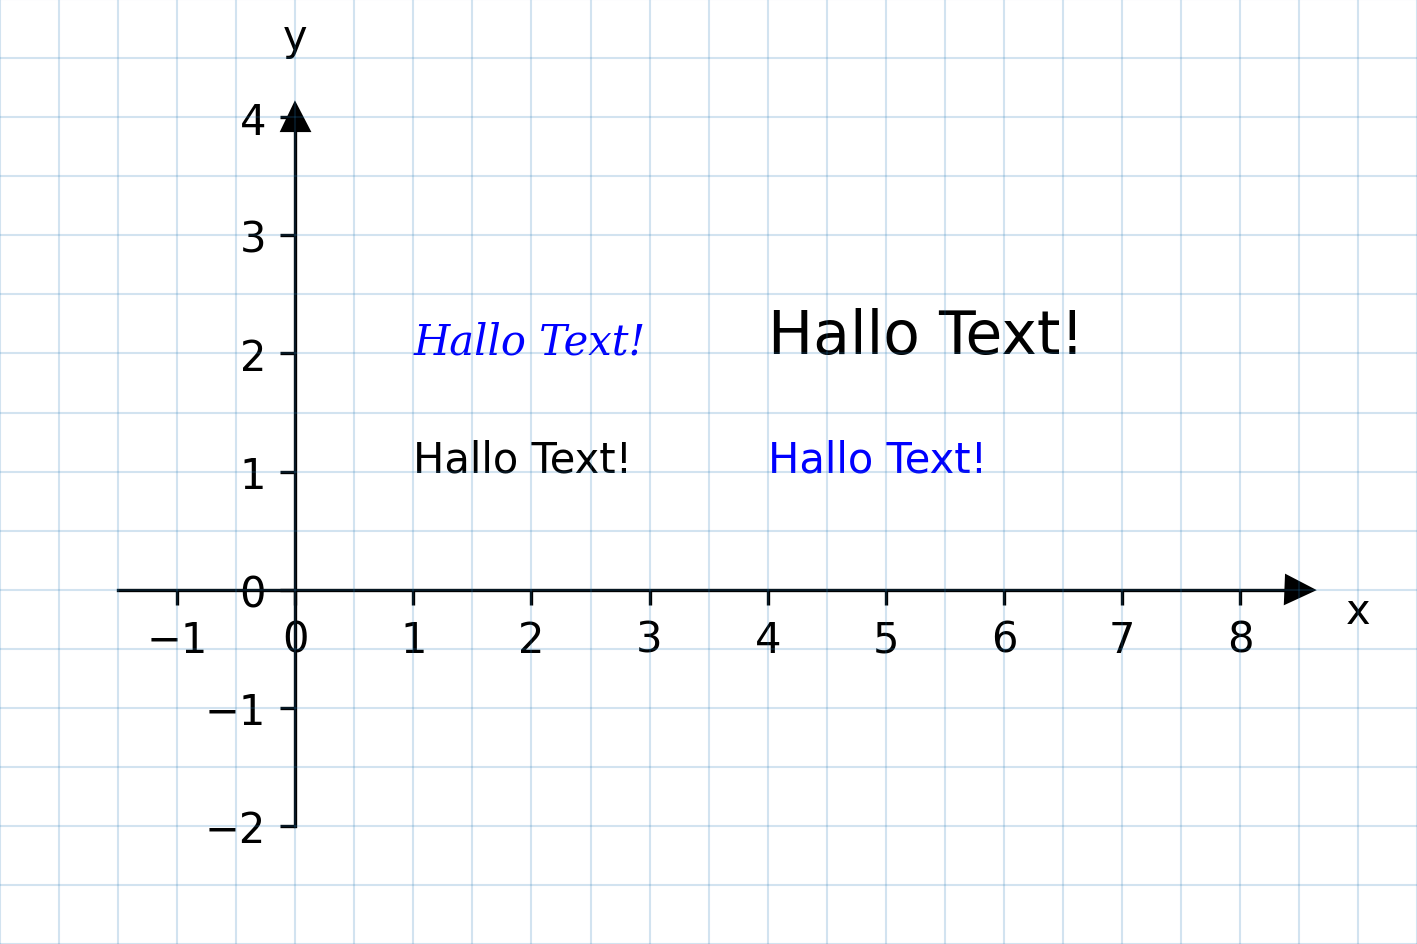
figure:
  height: 8cm
  width: 12cm
axes_descriptors:
- axes:
    height: 6cm
    width: 10cm
    x_min: -1.5
    y_min: -2
    show_legend: false
  bottom: 1cm
  left: 1cm
  items:
  - type: Text
    x: 1
    y: 1
    text: Hallo Text!
  - type: Text
    x: 4
    y: 1
    text: Hallo Text!
    text_args:
      color: blue
  - type: Text
    x: 1
    y: 2
    text: Hallo Text!
    text_args:
      color: blue
      fontfamily: serif
      fontstyle: italic
  - type: Text
    x: 4
    y: 2
    text: Hallo Text!
    text_args:
      fontsize: x-large
Beispiel 2: Text mit mehreren Zeilen
Texte können sich über mehrere Zeilen erstrecken. Dazu wird in der YAML-Datei eine spzeielle Syntax verwendet, die hier beschrieben wird.
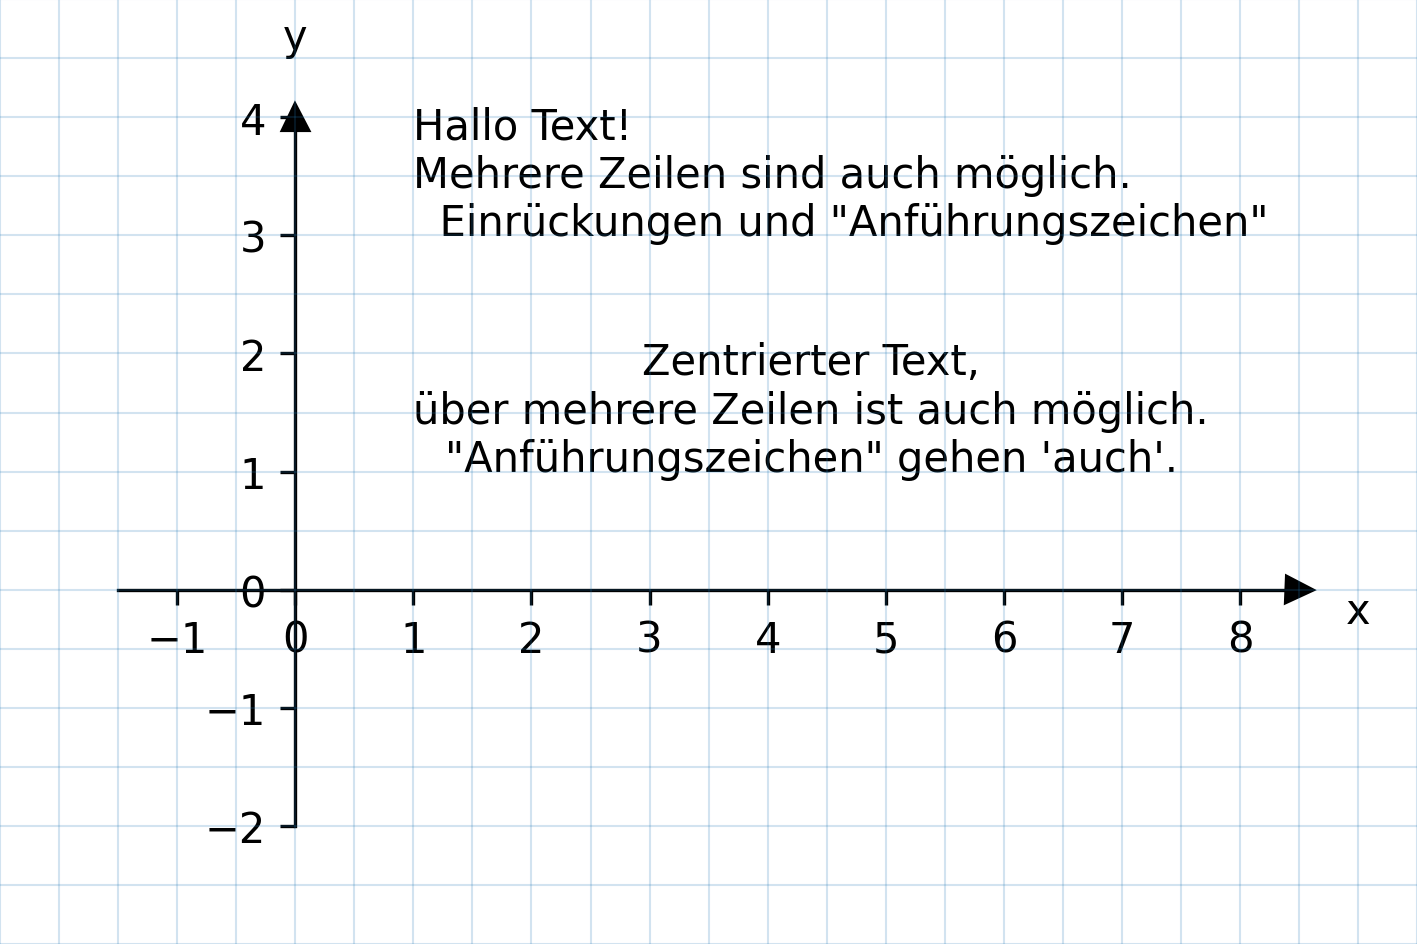
figure:
  height: 8cm
  width: 12cm
axes_descriptors:
- axes:
    height: 6cm
    width: 10cm
    x_min: -1.5
    y_min: -2
    show_legend: false
  bottom: 1cm
  left: 1cm
  items:
  - type: Text
    x: 1
    y: 3
    text: |-
      Hallo Text!
      Mehrere Zeilen sind auch möglich.
        Einrückungen und "Anführungszeichen"
  - type: Text
    x: 1
    y: 1
    text: |-
      Zentrierter Text,
      über mehrere Zeilen ist auch möglich.
      "Anführungszeichen" gehen 'auch'.
    text_args:
      ma: center
Beispiel 3: Bezugspunkte des Texts im Koordinatensystem
Textkoordinaten beziehen sich standardmäßig auf die linke untere Ecke des Textfeldes (genauer: auf die linke Baseline). Manchmal ist das nicht gewünscht, und es lassen sich andere Bezugspunkte einstellen. Eine Beschreibung der Bezugspunkte ist (hier)[https://matplotlib.org/stable/gallery/text_labels_and_annotations/text_alignment.html] zu finden.
In Schulplots lässt sich der Bezugspunkt mit Hilfe der Angabe von ha (oder horizontalalignment) und va (oder verticalalignment) in den text_args einstellen. Die möglichen Werte für ha sind baseline (Default), top, bottom, center und center_baseline. Für ha sind die Werte left (Default), right und center möglich.
Beachte, dass bei Texten ohne Unterlängen (d.h., wenn keine Buchstaben wie p,q,g vorkommen), bottom und baseline zusammenfallen.
Bei mehrzeiligem Text bestimmen ha und va den Bezugspunkt für das gesamte Rechteck, das den Text umgibt. Die horizontale Ausrichtung der einzelnen Zeilen lässt sich mit ma (oder multialignment) einstellen (siehe Beispiel 2).
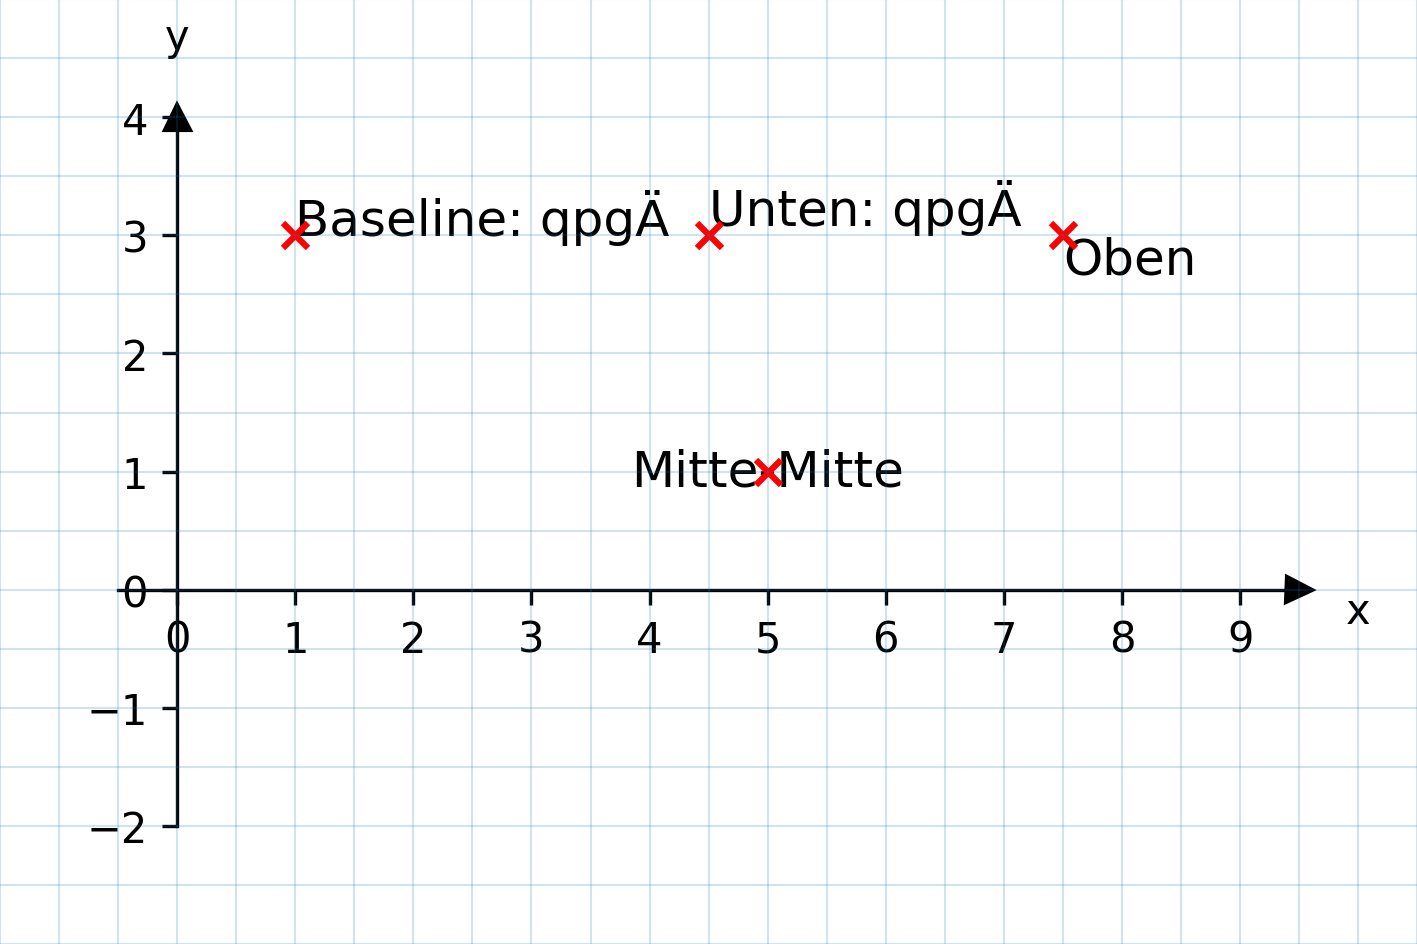
figure:
  height: 8cm
  width: 12cm
axes_descriptors:
- axes:
    height: 6cm
    width: 10cm
    x_min: -0.5
    y_min: -2
    show_legend: false
  bottom: 1cm
  left: 1cm
  items:
  - type: Text
    x: 1
    y: 3
    text: "Baseline: qpgÄ"
    text_args:
      va: baseline
      ha: left
      fontsize: large
  - type: Point
    x: 1
    y: 3
    plot_args_point:
      color: red
  - type: Text
    x: 4.5
    y: 3
    text: "Unten: qpgÄ"
    text_args:
      va: bottom
      ha: left
      fontsize: large
  - type: Point
    x: 4.5
    y: 3
    plot_args_point:
      color: red
  - type: Text
    x: 7.5
    y: 3
    text: "Oben"
    text_args:
      va: top
      ha: left
      fontsize: large
  - type: Point
    x: 7.5
    y: 3
    plot_args_point:
      color: red
  - type: Text
    x: 5
    y: 1
    text: "Mitte-Mitte"
    text_args:
      va: center
      ha: center
      fontsize: large
  - type: Point
    x: 5
    y: 1
    plot_args_point:
      color: red
Beispiel 4: Rotation des Textes
Bei der Rotation des Textes spielt die Reihenfolge des Alignements bzgl. des Bezugspunktes und der Rotation eine Rolle. Dies lässt sich mit rotation_mode einstellen:
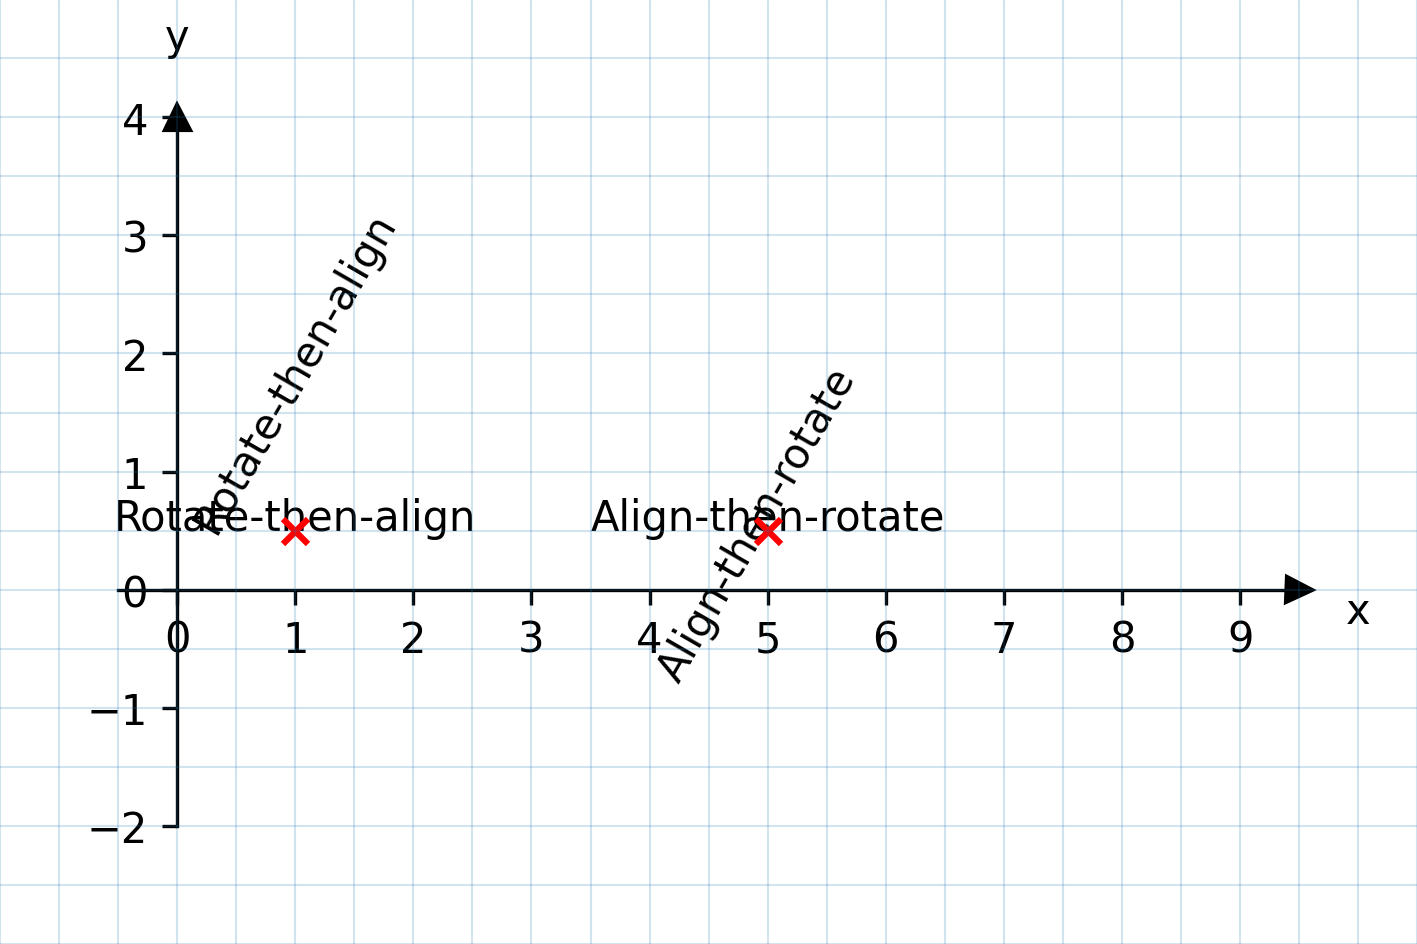
figure:
  height: 8cm
  width: 12cm
axes_descriptors:
- axes:
    height: 6cm
    width: 10cm
    x_min: -0.5
    y_min: -2
    show_legend: false
  bottom: 1cm
  left: 1cm
  items:
  - type: Text
    x: 1
    y: 0.5
    text: Rotate-then-align
    rotation: 0
    text_args:
      ha: center
  - type: Text
    x: 1
    y: 0.5
    text: Rotate-then-align
    rotation: 60
    text_args:
      ha: center
  - type: Point
    x: 1
    y: 0.5
    plot_args_point:
      color: red


  - type: Text
    x: 5
    y: 0.5
    text: Align-then-rotate
    rotation: 0
    text_args:
      rotation_mode: anchor
      ha: center
  - type: Text
    x: 5
    y: 0.5
    text: Align-then-rotate
    rotation: 60
    text_args:
      rotation_mode: anchor
      ha: center
  - type: Point
    x: 5
    y: 0.5
    plot_args_point:
      color: red